All figures on this page are conceptual illustrations built from synthetic geometry. None of them shows measured data, real images, or benchmark results. The review layout is an illustration, not a copy of internal software.
The Challenge
A useful anomaly is not every pixel that differs from its neighbor. In a large collection, images are noisy, the expected geometry repeats, and small changes sit inside normal variation. The task is to notice a mismatch that matters, say what kind of mismatch it is, and still finish the collection.
Three pressures shape the design:
- Volume. Reading every image by eye does not survive the size of the collection.
- Noise. Grain is normal. A rule that flags all of it hides the departures that matter.
- Mixed causes. A bright patch, a dark gap, a washed-out tone, an extra background mark, and a failed alignment do not look alike, and they are not one kind of error.
The design measures images in a consistent way, compares those measurements with what is typical for the collection, and then shows the evidence.
Understanding Visual Anomalies
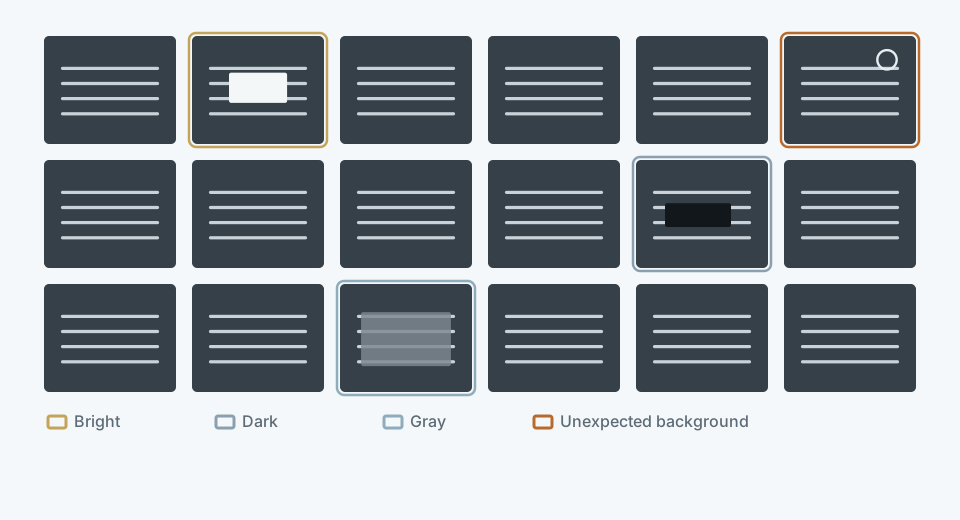
Most of the field is ordinary variation. The outlined tiles are the ones that ask a different question than their neighbors.
1 Normal pattern
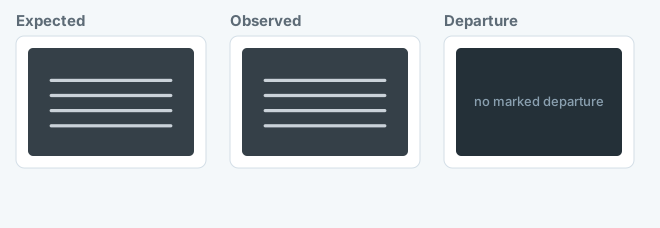
Grain is present, and nothing is marked. Normal variation belongs to the reference, not to the anomaly list.
2 Bright anomaly
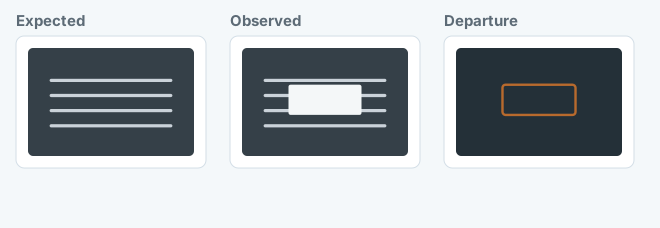
A region is far lighter than the lines around it. The departure is local and high.
3 Gray anomaly
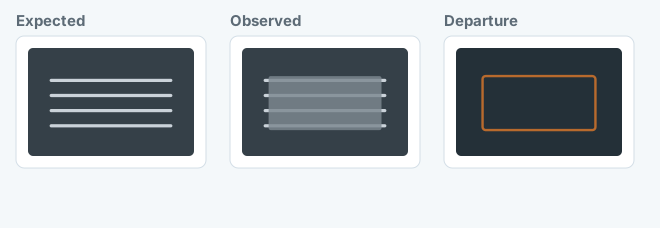
The structure is still there, but an intermediate tone has flattened it. This is a loss of contrast, not a missing shape.
4 Dark anomaly
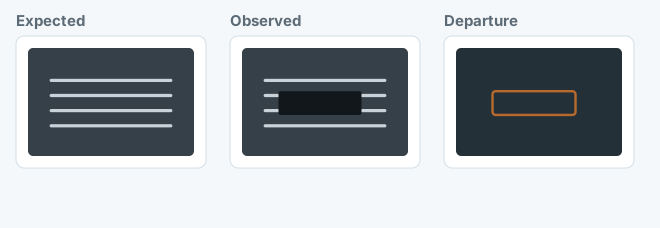
A gap replaces lines the geometry expects. The departure is local and low.
5 Background anomaly
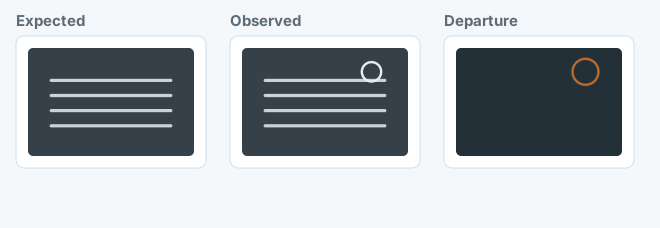
The lines agree, and an extra mark sits where the pattern should be empty. Measuring only the expected lines would miss it.
6 Low-correlation alignment
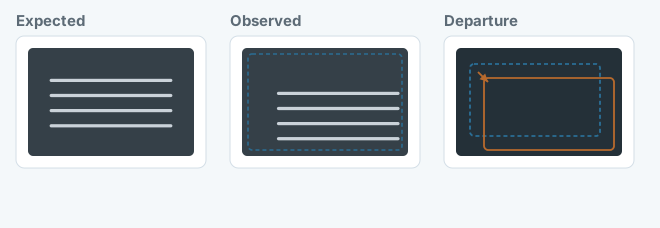
The pattern is shifted relative to the reference frame. Treating that shift as a local blot describes the wrong problem.
These are ways of describing a mismatch, not a set of exclusive classes. One image can show more than one. A weak alignment is different in kind from a local intensity change: the pattern may be intact and simply not where the measurement assumed.
System Architecture
Alignment, measurement, summary, and review fail in different ways, so they stay separate. A weak alignment means the measurement is not about the intended region. A measurement can be faithful and still be typical. A real departure still needs a person to see which signature it is.
- 1
Image Inputs
Each observation is one noisy view of the same kind of geometry.
- 2
Registration & Alignment
Place the observation on the reference. A weak agreement is kept as a result instead of being forced into a match.
- 3
Region-Based Measurements
Read intensity where the geometry expects structure, and treat the empty field as a separate question.
- 4
Parallel Statistical Analysis
Summarize the collection with a median and a spread that extremes do not define.
- 5
Anomaly Identification
Mark departures from that typical behavior, and keep the kind of departure attached to the mark.
- 6
Visual Diagnostics
Show the expected pattern, the observation, and the region so a person can check the flag.
Per-image work comes first because alignment and region readings do not need the rest of the collection. The typical image is a property of the set, so the summary waits. Review waits longer: it explains a flag, and it does not have to ride along with every measurement.
Robust Statistical Anomaly Detection
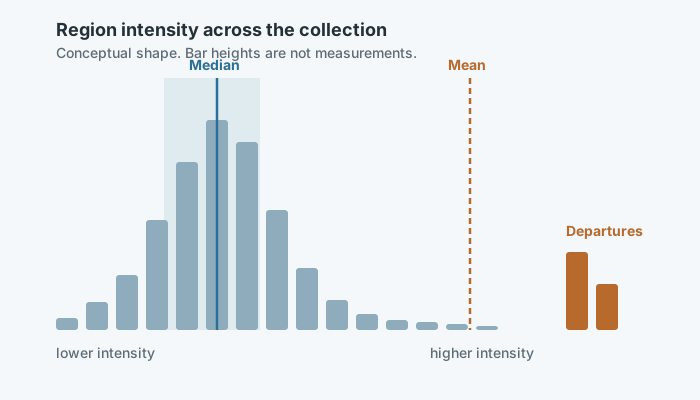
The cluster is the typical image. The orange bars are departures. Bar heights illustrate the shape of the problem, not a dataset.
A mean, and a spread based on squared deviations, moves when a few images are extreme. Those images then help define what counts as normal, which is the opposite of what a detector needs. The median stays with the dense part of the collection. The median absolute deviation measures spread from that median, so the same extremes do not set the width of the band.
A candidate departure is a measurement that sits far from the median relative to that width. How far is a tuning choice. This page does not state a threshold, a calibration, or a detection rule.
High-Throughput Processing
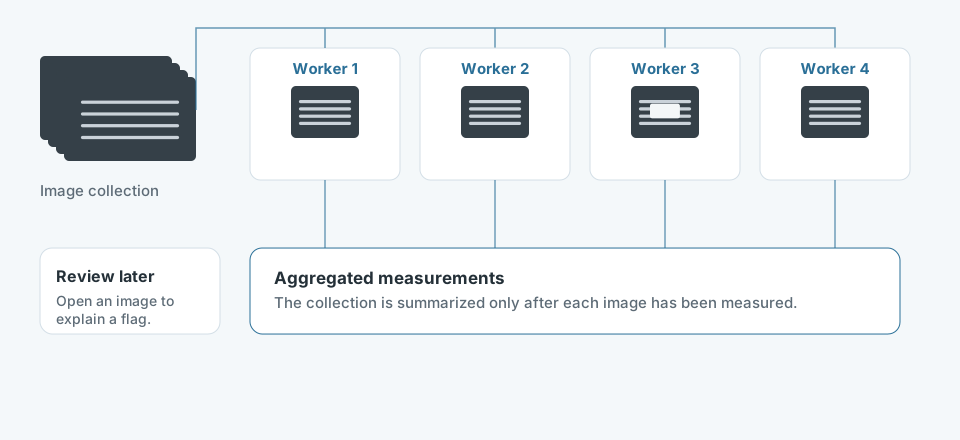
Workers do not need each other’s images. The summary does. The figure shows that split, not a runtime or a machine count.
Alignment and region measurements for one image do not depend on the others, so that work can run side by side as the collection grows. Median, spread, and the list of departures cannot start until those measurements exist. Opening every picture during that pass would spend time on images that never depart. Review stays after the summary, on the images a person needs to see.
From Detection to Diagnosis
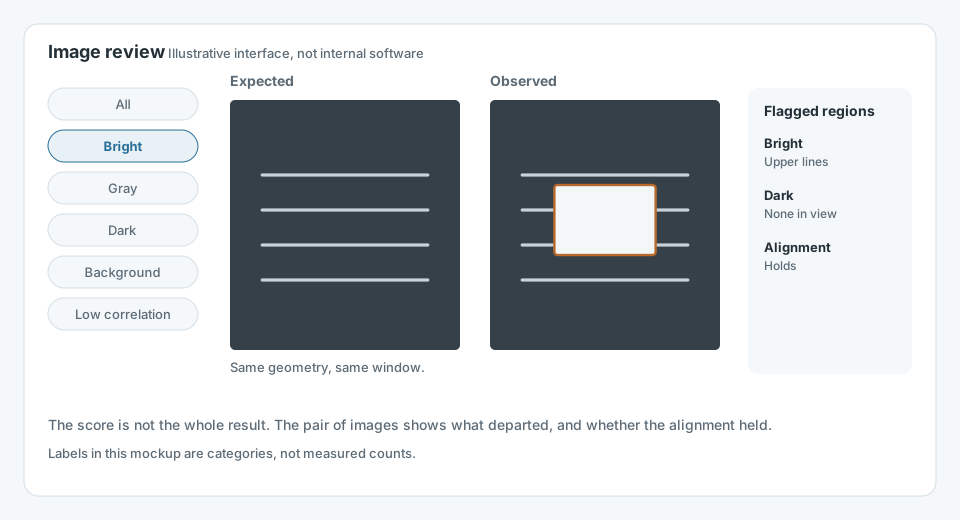
The pair of images is the explanation. Filters group signatures. Nothing in this layout is a measured count or an internal tool.
A flag answers whether a measurement is unusual. It does not show what an engineer should look at. The review puts the expected pattern next to the observation, outlines the region that departed, and keeps the alignment in view so a shift is not mistaken for a local blot. Grouping by signature lets a person walk through one kind of mismatch at a time.
Engineering Trade-offs
Sensitivity and false alarms
Widening what counts as a departure catches subtler mismatches and also promotes grain into the review queue. Tightening it keeps the queue short and can pass over a real but small signature.
Throughput and what gets measured
Reading only the expected regions is cheaper, and it can miss a surprise in the background. Reading the whole image costs more, and that cost is what makes an unexpected mark visible. The two questions stay separate so the extra work is paid only where the question requires it.
Automation and a check a person can make
A score scales past a manual scan of the collection. It is not an explanation. The review exists so a person can confirm the signature and the alignment instead of trusting the score alone.
Engineering Outcomes
These are capabilities of the design, not measured results.
The same measurement, at collection scale
Each image is aligned and read in the same way. The collection is summarized only after those readings exist, so the analysis can grow with the set.
Signatures stay distinguishable
Bright, gray, dark, and background mismatches are not collapsed into one score. A failed alignment stays visible as an alignment problem.
Investigation starts from the flag
Review opens on the expected pattern, the observation, and the region that departed, rather than on a pass through every image.
Review stays off the measurement pass
Pictures are opened to account for a departure. Images that stay inside the typical band do not have to be rendered for that account.